A Pressurization Primer
By Jeff Lucius
This short note is a quick review of the processes and controls involved in pressurizing the intake plenum and manifold on our turbocharged 3000GT/Stealths. This discussion focuses on the pressure, temperature, mass, and volume changes experienced by air as it travels to the intake manifold. In addition, because this is a dynamic system, I will talk about air flow, that is the movement of mass or volume over time.
The Basics
The figures below show a cutaway view of our engine and a schematic of our intake system. Air enters the system through the air filter and mass air sensor (MAS), from there the path is split, one going to each turbo. After the turbo increases both the pressure and temperature, the air goes through the intercooler (IC), where temperature, volume, and pressure are reduced, and on to the throttle body (TB) and intake plenum and manifold.
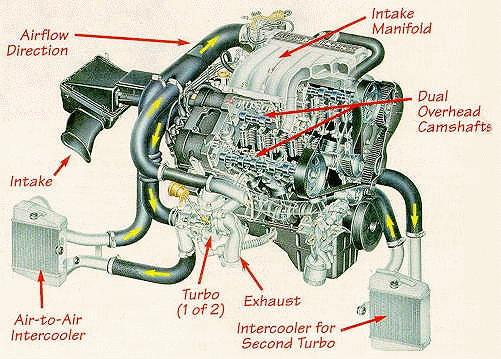
Figure 1. Artistic cutaway of the Mitsubishi 6G72 turbocharged engine (from Mitsubishi promotional material). |
Figure 2. Schematic of air intake path for Mitsubishi 6G72 turbocharged engine (base figure from 1991 Stealth Technical Information Manual). |
The basic (macro-scale) properties of air are pressure (P), volume (V), temperature (T), and mass (m equal to n/M, the number of moles, n, divided by the molecular mass, M). The Ideal Gas Law, P x V = n x R x T, describes the relationship of the air's properties outside of the turbo (R is the universal gas constant). Inside of the turbo's compressor housing, adiabatic processes describe changes in the air's properties. Since M and R are constant the Ideal Gas Law can be rewritten as a proportional one, P x V ≈ m x T. This just means that if the left side of the expression doubles so does the right side. It also means that if T decreases while m is constant then P or V (or both) also decreases (or more correctly, P x V decreases).
Air Property Transformations
For our turbocharged engine, the air's properties change considerably as the air progresses from the air filter to the intake manifold. To illustrate, consider the pressure, temperature, and density (mass per unit volume) of a single volume of air, say one cubic foot (CF), at each of the numbered locations in figure 2.
At station 1, the air is about to enter the filter and MAS. Let us start with pressure P equal to 14.7 psi (sea-level standard) and temperature T equal to 90ºF (under-hood temperature). The mass of one cubic foot of that air would be 32.746 grams (density = 32.746 g/CF = 0.0722 lb/CF = 1.1564 g/L). The air density, D, is determined using the following formula derived from the Ideal Gas Law and empirical measurements (you can find these in the CRC Handbook of Chemistry and Physics).
D = D0 x (T0/T) x (P/P0), where
T0 = 545.69ºR (86ºF) or 303.15ºK (30ºC),
P0 = 14.7 psi (= 1 atm = 760 mm Hg = 29.92" Hg = 1.033 kg/cm2 = 1.013 bar = 33.9 ft H2O), and
D0 = 1.1649 g/L = 32.986 g/CF = 0.072751 lb/CF.
Note that T, P, T0, and P0 must be in absolute temperature and pressure. For ºF add 459.69 to get ºRankine and for ºC add 273.15 to get ºKelvin. You can use my air density calculator to determine density at various temperatures and pressures
At station 2, the air is about ready to enter the compressor housing of each turbocharger. The pressure has dropped a small amount (say 1.0 psi) from the restrictions caused by the air filter, the MAS, and bends in the intake hose. The temperature has probably not changed much. The flow rate was split, with half the intake air going to each turbocharger. The density of the air about to enter the turbo is 30.518 g/CF (T=90ºF, P=13.7 psi).
As the air proceeds into the turbocharger's compressor wheel it is accelerated outward away from the center of the wheel. When this accelerated air enters the diffuser part of the compressor housing, the velocity decreases (due to the increasing area) and the static pressure increases. This compression process increases both the temperature and pressure according to the rules of adiabatic compression and the limitations of the compressor's efficiency. If the turbo has increased the pressure by a factor of 2 (pressure ratio, PR, equal to 2) and the compressor was operating at 70% efficiency, then the air temperature at station 3 increased to 260ºF (see equations in adiabatic processes and my turbo outlet temperature calculator) and the absolute pressure increased to 27.4 psi (2 x 13.7). The air density at station 3 is now 46.619 g/CF. Note that because the temperature has increased as well as the pressure, the density has not doubled from station 1 but increased by a factor of 1.42 (46.619/32.746), also called the density ratio, DR. The PR at station 3 with respect to station 1 is 1.864.
The intercooler (IC) is supposed to cool this hot air without decreasing the pressure very much, thus increasing the density of the air and decreasing the volume. A good intercooler can reduce the difference in the compressed air temperature and the ambient air temperature by 80 percent or more and the air pressure by about only 1 to 3 psi. Assuming an ambient air temperature of 70ºF, 80% IC efficiency, and 1.5 psi IC pressure loss, at station 4 the air temperature would be 108ºF, the air absolute pressure would be 25.9 psi, and the air density would be 55.866 g/CF. Using the absolute temperatures and pressures and the expression V ≈ m x T/P, you can determine that the volume decreased by about 16.5% ([568/25.9]/[720/27.4]. There are also small pressure losses, and perhaps even temperature changes, related to the IC pipes and hoses that are ignored in this simple example.
If we assume the TB at wide open throttle (WOT) does not present much of a restriction, then at station 5 (inside the plenum) the overall DR would be 1.762 (55.866/32.746) and the overall PR would be 1.706 (25.9/14.7) with a boost gauge pressure of 11.2 psi (25.9-14.7). The table below summarizes these air-property transformations.
| Air Property Transformations |
| Station |
Pressure |
Temp. |
Density |
PR |
DR |
| |
(PSIa) |
(ºF) |
(g/CF) |
(lb/CF) |
(relative to sta. 1) |
| 1 |
14.7 |
90 |
32.746 |
0.0722 |
1.000 |
1.000 |
| 2 |
13.7 |
90 |
30.518 |
0.0673 |
0.932 |
0.932 |
| 3 |
27.4 |
260 |
46.619 |
0.1028 |
1.864 |
1.424 |
| 4 & 5 |
25.9 |
108 |
55.866 |
0.1232 |
1.762 |
1.706 |
It is important to note that pressure losses across the air filter and MAS and in the IC system actually vary with air flow. Larger losses are associated with higher engine speeds and with higher boost levels. It is also interesting that the turbocharger has to work at the 2.0 PR level (13.7 psi gauge at exit) in this example to produce 11.2 psi boost in the plenum.
The Dynamic System
Because air is flowing through our system, there must be a difference in pressure from one end to the other. At one end of the system, the pistons moving down in the cylinders during the intake stroke generate low pressure. The atmosphere or the turbocharger provides the higher pressure at the other end. With a turbocharger, the compressor wheel rotation also causes a depression in the intake hose drawing air through the air filter. When the intake valves open, air rushes in to fill the cylinders. At idle when the throttle body (with the throttle plate closed) is severely limiting the volume of outside air that can enter the plenum, there is a vacuum in the intake plenum and manifold. On the other hand, at WOT, the manifold air pressure would be close to atmospheric in a normally aspirated engine, or greater than atmospheric pressure in a turbocharged engine.
The same volume of air is drawn in as the piston moves down regardless of engine speed (RPM), load (throttle opening), or intake manifold pressure. This volume is the cylinder displacement. However, the mass of air that is drawn in varies quite a bit. Rather than trying to measure that mass directly, the stock 6G72 control system measures the volume of outside air that is drawn through the MAS and calculates the mass from the air temperature and atmospheric pressure. Knowing the air mass and the rate of flow (and the engine operating conditions), the electronic control unit (ECU) determines how much fuel to inject into the cylinders. In addition, the ECU calculates (not measures) what the boost pressure or vacuum in the plenum should be.
The volumetric efficiency (VE) of an engine is the ratio of the volume of outside air that enters all of the cylinders to the actual engine displacement. The VE is not constant and changes with load (or throttle position) and RPM. VE is very low at idle and low-load cruising. At WOT, the torque curve reflects the relative values of VE. That is, the highest torque values are where the VE is the highest.
In a normally-aspirated engine, "natural" VE is usually less than 100% because of exhaust gas reversion (exhaust gas present in the cylinder or intake manifold during the intake stroke) and air flow restrictions caused by the combustion chamber design, valves, head ports, throttle plate, air filter, and the pipes and hoses connecting everything. In a turbocharged engine, the "pressurized" VE depends on both the natural VE and the overall density ratio. For example, if one of our 6G72 engines has a natural VE of 95% at a certain engine speed and load and the overall DR is 1.7 (like above), then the VE is about 162% (0.95 x 1.7). For practical purposes, forced induction means that our 181 cubic inch (CI) displacement engine is functioning like an engine 1.7 times larger, or 308 CI, in this particular case.
Volume Flow vs Mass Flow
The final topic I would like to discuss here is volume flow versus mass flow. A turbocharger increases the volume of air that can flow through an engine, allowing the engine to burn more fuel each cycle and therefore make more power than a normally-aspirated engine of the same displacement. The volume air flow (VAF), measured here in cubic feet per minute (CFM), is a linear function of engine displacement (here in CI), compression cycles per minute (RPM/2), and volumetric efficiency, as shown in the following equation.
VAF = (CI/1728) x (RPM/2) x VE
As discussed above, volumetric efficiency depends on both the normal flow capacities (natural VE) as well as the overall density ratio. Using the example above where VE=1.62, then we might think that at 7000 RPM our 181 CI engine would be flowing 594 CFM. The stock TD04-9B turbos are reported to flow about 265 CFM each at a 2.0 pressure ratio. This 530 CFM total falls short of the 594 CFM required until we realize that at 7000 RPM our engines probably only flow about 75% of their displacement (natural VE = 0.75). The revised VE would be 0.75 x 1.7 = 1.275. Now VAF only comes to 467 CFM, well within the flow capabilities of the stock turbos. To determine a 75% flow capacity at 7000 RPM, I assumed a 95% flow capacity at the torque peak in figure 3 and a linear relationship between torque and VE.
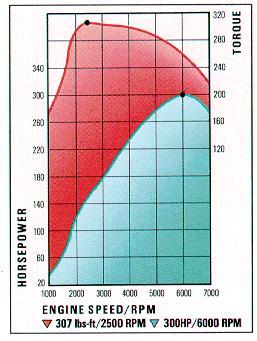
Figure 3. Mitsubishi GTO dyno chart (from Mitsubishi promotional material). |
Compression in the cylinder (as well as in the turbocharger) is an adiabatic process depending only on the change in volume, and is independent of air mass, temperature, and pressure. However, to achieve the correct mixture of gasoline and air for optimal combustion, the mass of each must be known. The average density of gasoline is about 6 pounds per gallon (or 690 to 760 g/L depending on grade and additives) and does not vary with small changes in temperature or pressure. On the other hand, air density can change significantly with small changes in pressure or temperature. It is a relatively easy process to measure the volume air flow, temperature, and pressure and then calculate the air density (as shown above).
If you know the volume air flow, VAF, in CFM and the air density in g/L then you can calculate the mass air flow, MAF, in lb/hr with the following equation.
MAF = VAF x D x 3.747
If the air density is in g/CF then you can calculate the mass air flow in lb/hr with this equation.
MAF = VAF x D x 0.1323
If the air density is in lb/CF then you can calculate the mass air flow in lb/hr with this equation.
MAF = VAF x D x 60
In the example above, the 467 CFM volume air flow is equivalent to 2023 lb/hr mass air flow (467 x 32.746 x 0.1323). If the ECU determined that a 12.5:1 air/fuel mixing ratio was appropriate for the engine conditions, then about 162 lb/hr of fuel flow would be required. For our six-cylinder engine this is equivalent to 284 cc/min (162 x 10.5 / 6) for each injector. The stock 360 cc/min fuel injectors would be working at 79% capacity, or at 79% injector duty cycle (IDC). This is near the upper end of safe, continuous injector operation.
As a final example, let us consider upgrading the turbos and determining the appropriately sized fuel injectors. The TD04-15G turbo is a popular performance upgrade for our cars. Each 15G turbo can flow about 405 CFM at pressure ratios of 1.7 to 2.7. Using the equations and examples above and a 75% natural VE at 7000 RPM, to flow 810 CFM the VE would have to be 2.21 and the overall density ratio would be 2.95 (2.21 / 0.75) with an even higher overall PR. Because this overall DR already exceeds the operational range of the 15G, we would have to improve the VE of our engine to take full advantage of this upgrade. In fact, this is normally what we do. We upgrade the intake and exhaust systems and often improve the head flow characteristics. By improving flow capacity to 85% at 7000 RPM, we reduce the overall DR to 2.6 (2.21 / 0.85) and get a PR at the turbo near its upper operating limit. Using the environmental conditions in the first example, 810 CFM VAF is equivalent to 3512 lb/hr MAF. At a 12.5:1 A/F, 281 lb/hr of fuel would be needed, or 491 cc/min per injector. Operating at 90% IDC, 550 cc/min injectors would be adequate, but 615 cc/min injectors (if available) operating at 80% IDC would be better.
Conclusions
The air intake system on our turbocharged engine is designed to increase the air density when the engine is under load to improve power output. By measuring the basic properties of air at various points in the system we can determine both individual component and overall efficiency. By quantifying air volume and mass flow we can access the usefulness and results of engine upgrades such as higher-capacity turbochargers or fuel injectors.
Look at some of the books I list in "Recommended Reading" for additional information and more-detailed discussions.
Page last updated March 17, 2002.